
테스트 환경
NCP에 리눅스 서버 1대 생성
OS : CentOS 7.8
ELK 란?
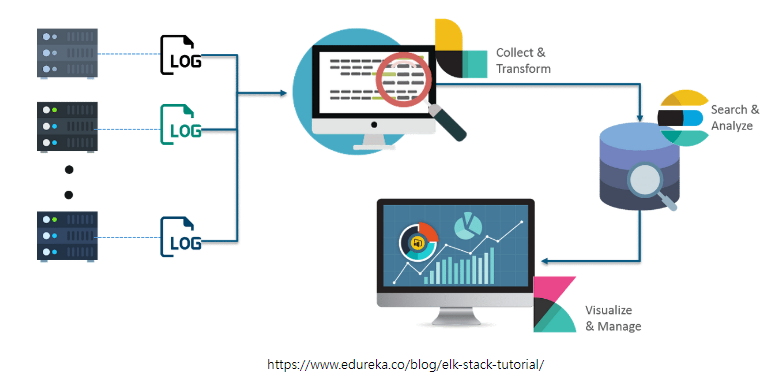
ELK Stack의 ELK는 Elasticsearch(일라스틱서치), Logstash(로그스태시), Kibana(키바나)의 첫 글자를 딴 용어이다. 각각은 로깅 시스템을 위한 수집, 전달, 시각화를 담당한다. 세개의 오픈소스 툴을 함께 사용함으로써 로그를 수집하고 중앙으로 모아서 분석하는 로깅 시스템을 구축할 수 있다.
서버(로그발생) ⇒ Logstash(로그 수집) ⇒ Elasticsearch(수집한 로그 가져옴) ⇒ Kibana(가져온로그 가시화&모니터링)
Elasticsearch는 Lucene 검색 엔진을 기반으로 데이터를 저장하고 검색, 집계를 수행하는 분산형 오픈소스 검색 엔진이다. 텍스트, 숫자, 정형 및 비정형 데이터 등 다양한 유형의 데이터를 다룰 수 있으며 뛰어난 검색 능력을 가지고 있다. 또한 표준 RESTful API를 제공하며 수평적 확장을 통해 간단하고 안정적으로 데이터 검색을 수행한다는 특징이 있으며 상세한 분석을 위해 쿼리 기능도 제공한다.
위와 같이 데이터 검색을 수행하는 Elasticsearch는 ELK Stack에서 가장 중요한 요소라고 해도 과언이 아닐 만큼 핵심 역할을 담당하고있다.
Logstash는 실시간 파이프라인 기능을 가진 오픈소스 데이터 수집 엔진이다. elasticsearch와 마찬가지로 다양한 유형의 로깅 데이터를 처리할 수 있으며 함께 사용되는 beats(Filebeat 등)로부터 로그를 전달받아 사용할 수 있다. 또한 파이프라인 기능을 통해 다양한 소스의 데이터를 하나의 목적지로 통합할 수 있으며 통합한 데이터를 정규화할 수 있다. 즉 elasticsearch가 데이터 검색 및 집계를 수행할 수 있도록 다양한 소스로부터 데이터를 모아주는 기능을 담당한다.
ELK Stack에서 Logstash를 Fluentd로 대체하여 EFK Stack으로 쓰기도 한다. Fluentd도 Logstash와 비슷한 로그 수집 기능수행한다. 차이점은 Logstash는 자바 런타임이 필요한 JRuby로 되어있지만 Fluentd는 자바 런타임이 필요하지 않은 CRuby로 되어있다는 점이다. 또한 Logstash보다 Fluentd가 사용하기에 좀 더 가볍다는 특징이 있다.
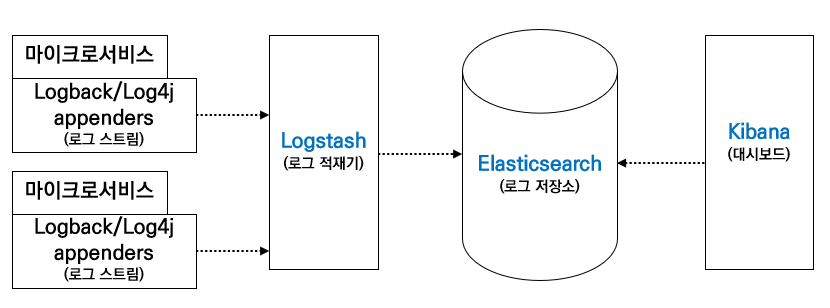
Kibana는 elasticsearch에서 검색한 데이터를 웹 브라우저 대시보드를 기반으로 시각화하는 역할을 담당한다. 수집하고 집계한 데이터 중 대시보드에 나타내고자 하는 소스를 선택하여 사용자가 보기 쉽게 통계 정보를 나타내어준다. 데이터 소스는 elasticsearch가 데이터를 저장하고 검색할 때 생성되는 인덱스를 의미한다. 즉 logstash로 분산되어있는 데이터를 한곳으로 모은 다음 elasticsearch에 저장하고 인덱스를 생성한다. 그 후 생성한 인덱스 중 Kibana 대시보드에 나타내고자 하는 데이터를 선택하여 그래프와 같은 사용자 인터페이스로 나타내어준다.
<ELK Stack 흐름 구성도>
ELK Stack 구성하기 (Linux)
1. Elasticsearch 설치하기
1) repo 파일 작성
vi /etc/yum.repos.d/elasticsearch.repo
아래 내용 복사하여 붙여넣기
[elasticsearch]
name=Elasticsearch repository for 7.x packages
baseurl=https://artifacts.elastic.co/packages/7.x/yum
gpgcheck=1
gpgkey=https://artifacts.elastic.co/GPG-KEY-elasticsearch
enabled=0
autorefresh=1
type=rpm-md
2) Elasticsearch 설치
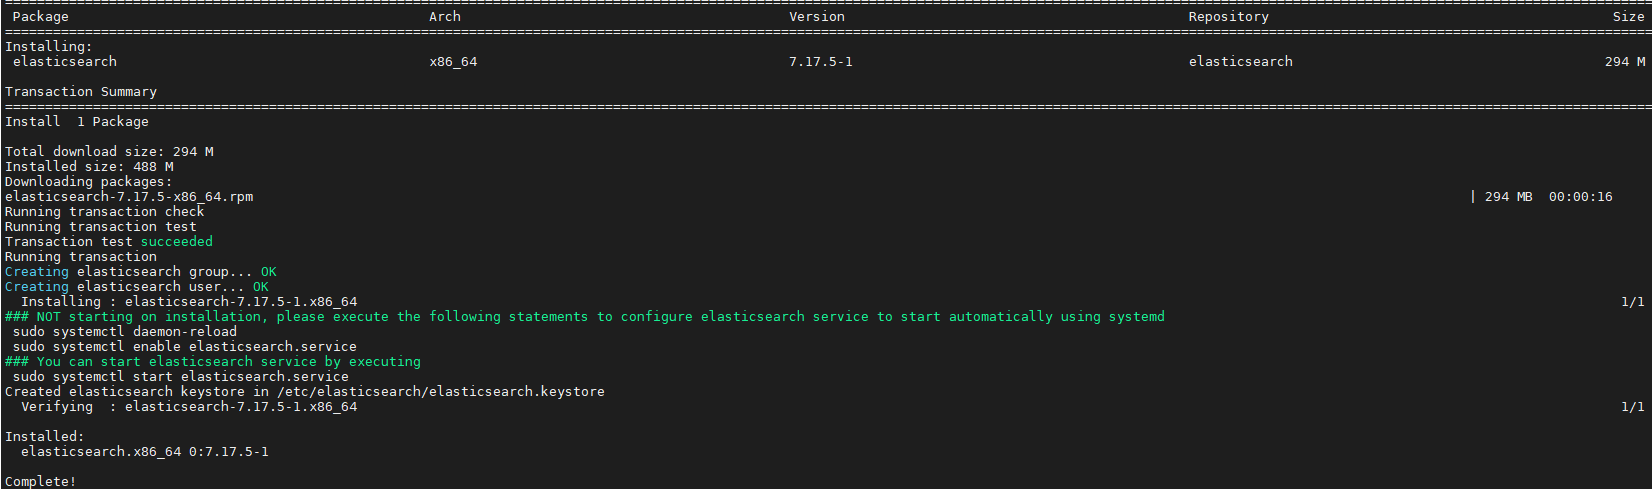
yum install -y --enablerepo=elasticsearch elasticsearch
3) elasticsearch.yml 파일 수정
vi /etc/elasticsearch/elasticsearch.yml
아래 내용 참고하여 수정하기
# ---------------------------------- Network -----------------------------------
#
# By default Elasticsearch is only accessible on localhost. Set a different
# address here to expose this node on the network:
#
network.host: 0.0.0.0
#
# By default Elasticsearch listens for HTTP traffic on the first free port it
# finds starting at 9200. Set a specific HTTP port here:
#
http.port: 9200
#
# For more information, consult the network module documentation.
#
# --------------------------------- Discovery ----------------------------------
#
# Pass an initial list of hosts to perform discovery when this node is started:
# The default list of hosts is ["127.0.0.1", "[::1]"]
#
#discovery.seed_hosts: ["host1", "host2"]
#
# Bootstrap the cluster using an initial set of master-eligible nodes:
#
cluster.initial_master_nodes: 110.165.19.222
#
# For more information, consult the discovery and cluster formation module documentation.
#
# ---------------------------------- Various -----------------------------------
4) 시스템 재시작
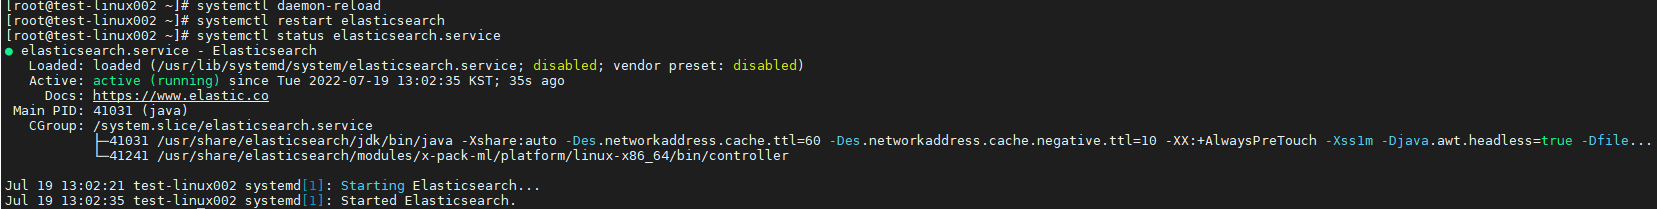
systemctl daemon-reload
systemctl restart elasticsearch
systemctl status elasticsearch
2. Logstash 설치하기
1) repo 파일 작성
vi /etc/yum.repos.d/logstash.repo
아래 내용 복사하여 붙여넣기
[logstash-7.x]
name=Elastic repository for 7.x packages
baseurl=https://artifacts.elastic.co/packages/7.x/yum
gpgcheck=1
gpgkey=https://artifacts.elastic.co/GPG-KEY-elasticsearch
enabled=1
autorefresh=1
type=rpm-md
2) Logstash 설치하기
yum install -y logstash
3) conf 파일 작성
vi /etc/logstash/conf.d/logstash.conf
아래 내용 작성
input {
beats {
port => 5044
host => "0.0.0.0"
}
}
filter {
if [system][process] {
if [system][process][cmdline] {
grok {
match => {
"[system][process][cmdline]" => "^%{PATH:[system][process][cmdline_path]}"
}
remove_field => "[system][process][cmdline]"
}
}
}
}
output {
elasticsearch {
hosts => "110.165.19.222:9200"
manage_template => false
index => "%{[@metadata][beat]}-%{[@metadata][version]}-%{+YYYY.MM.dd}"
}
}
4) 서비스 재시작
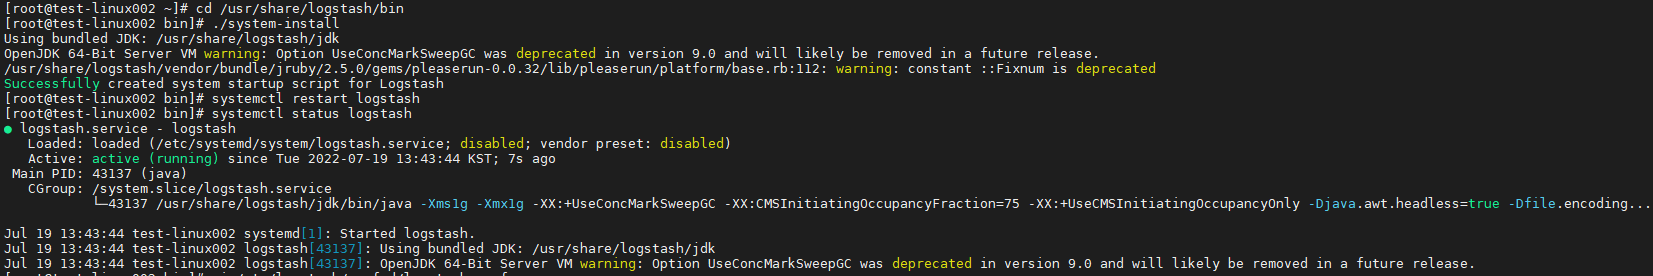
cd /usr/share/logstash/bin
./system-install
systemctl restart logstash
systemctl status logstash
3. Kibana 설치하기
1) repo 파일 작성
vi /etc/yum.repos.d/kibana.repo
아래 내용 복사하여 붙여넣기
[kibana-7.x]
name=Kibana repository for 7.x packages
baseurl=https://artifacts.elastic.co/packages/7.x/yum
gpgcheck=1
gpgkey=https://artifacts.elastic.co/GPG-KEY-elasticsearch
enabled=1
autorefresh=1
type=rpm-md
2) Kibana 설치하기
yum install -y kibana
3) kibana.yml 파일 수정
vi /etc/kibana/kibana.yml
아래 내용 참고하여 주석 삭제 및 내용 수정
# Kibana is served by a back end server. This setting specifies the port to use.
server.port: 5601
# Specifies the address to which the Kibana server will bind. IP addresses and host names are both valid values.
# The default is 'localhost', which usually means remote machines will not be able to connect.
# To allow connections from remote users, set this parameter to a non-loopback address.
server.host: [서버의 사설IP]
# Enables you to specify a path to mount Kibana at if you are running behind a proxy.
# Use the `server.rewriteBasePath` setting to tell Kibana if it should remove the basePath
# from requests it receives, and to prevent a deprecation warning at startup.
# This setting cannot end in a slash.
#server.basePath: ""
# Specifies whether Kibana should rewrite requests that are prefixed with
# `server.basePath` or require that they are rewritten by your reverse proxy.
# This setting was effectively always `false` before Kibana 6.3 and will
# default to `true` starting in Kibana 7.0.
#server.rewriteBasePath: false
# Specifies the public URL at which Kibana is available for end users. If
# `server.basePath` is configured this URL should end with the same basePath.
#server.publicBaseUrl: ""
# The maximum payload size in bytes for incoming server requests.
#server.maxPayload: 1048576
# The Kibana server's name. This is used for display purposes.
#server.name: "your-hostname"
# The URLs of the Elasticsearch instances to use for all your queries.
elasticsearch.hosts: ["http://110.165.19.222:9200"]
4) 서비스 재시작

systemctl enable kibana
systemctl start kibana
systemctl status kibana
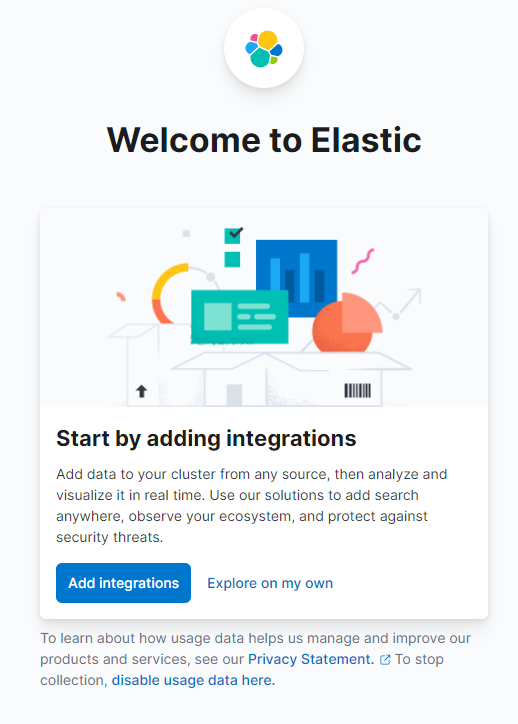
5) 웹콘솔 접근 확인
주소창에 http://서버공인IP:5601 로 접속 확인
'Linux Server' 카테고리의 다른 글
| [Ubuntu20.04] MySQL 8.0 설치 (0) | 2023.03.08 |
|---|---|
| [Linux] CentOS7 에서 K8S 클러스터, ArgoCD 구성하기 (0) | 2022.09.28 |
| [Linux] Ubuntu에서 CUDA 설치하기 (0) | 2022.09.19 |
| [Linux] Ubuntu 20.04 Apache2 Webdav 구축 (1) | 2022.09.16 |
| [Linux] Ubuntu MySQL 8.0 데이터 저장소 변경 (0) | 2022.09.16 |


